You Don't Need Another Dashboard or AI Agent

When leadership asks for better marketing reporting, the default response is often a new BI (Business Intelligence) tool. Six months later, the organization may run a dozen Looker tabs, several AI copilots, and the same weekly debate about whether GA4 (Google Analytics 4) or HubSpot has the correct pageview count.
The pattern is familiar: there is no single place to see performance the same way twice. Teams add dashboards because channel owners want their own view, not because executives lack charts. Dashboard sprawl and AI agent sprawl share the same root cause: a new interface on top of ungoverned, siloed data.
The fix is not another visualization layer. It is a KPI (Key Performance Indicator) specification with named owners, locked formulas, and a connected data layer across web, ads, and CRM (Customer Relationship Management). Dashboards and agents can follow. Governance must come first.
Why another dashboard will not fix "different numbers, different definitions"
The average martech stack now runs 17 to 20 platforms. In the 2025 State of Marketing Attribution Report, 65.7% of marketers cite data integration as their top challenge. The barrier is not visualization. It is fragmented schemas and inconsistent metric definitions.
A common misconception holds that more dashboards produce more insight. In practice, adding a chart to a broken data layer creates another disagreement in the next leadership meeting, not clarity. Only 31% of marketers report full satisfaction with their ability to unify customer data sources (Salesforce State of Marketing, 9th Edition). Each new dashboard inherits its source system's logic.
Typical meeting dynamics illustrate the problem:
- GA4 (Google Analytics 4) reports one pageview total.
- HubSpot reports another.
- Salesforce shows CRM-sourced pipeline that does not match either.
Twenty minutes of a weekly executive session can disappear debating which platform is "right" instead of deciding budget reallocation.
The root cause is definitional, not cosmetic. Google Ads calculates platform ROAS (Return on Ad Spend). Finance may track blended MER (Marketing Efficiency Ratio). Sales reports CRM-sourced pipeline. The metric names overlap. The formulas do not.
Nobody has signed what "marketing-influenced revenue" or "ROAS" actually means in that organization. Leadership does not lack a prettier chart. It lacks a contract.
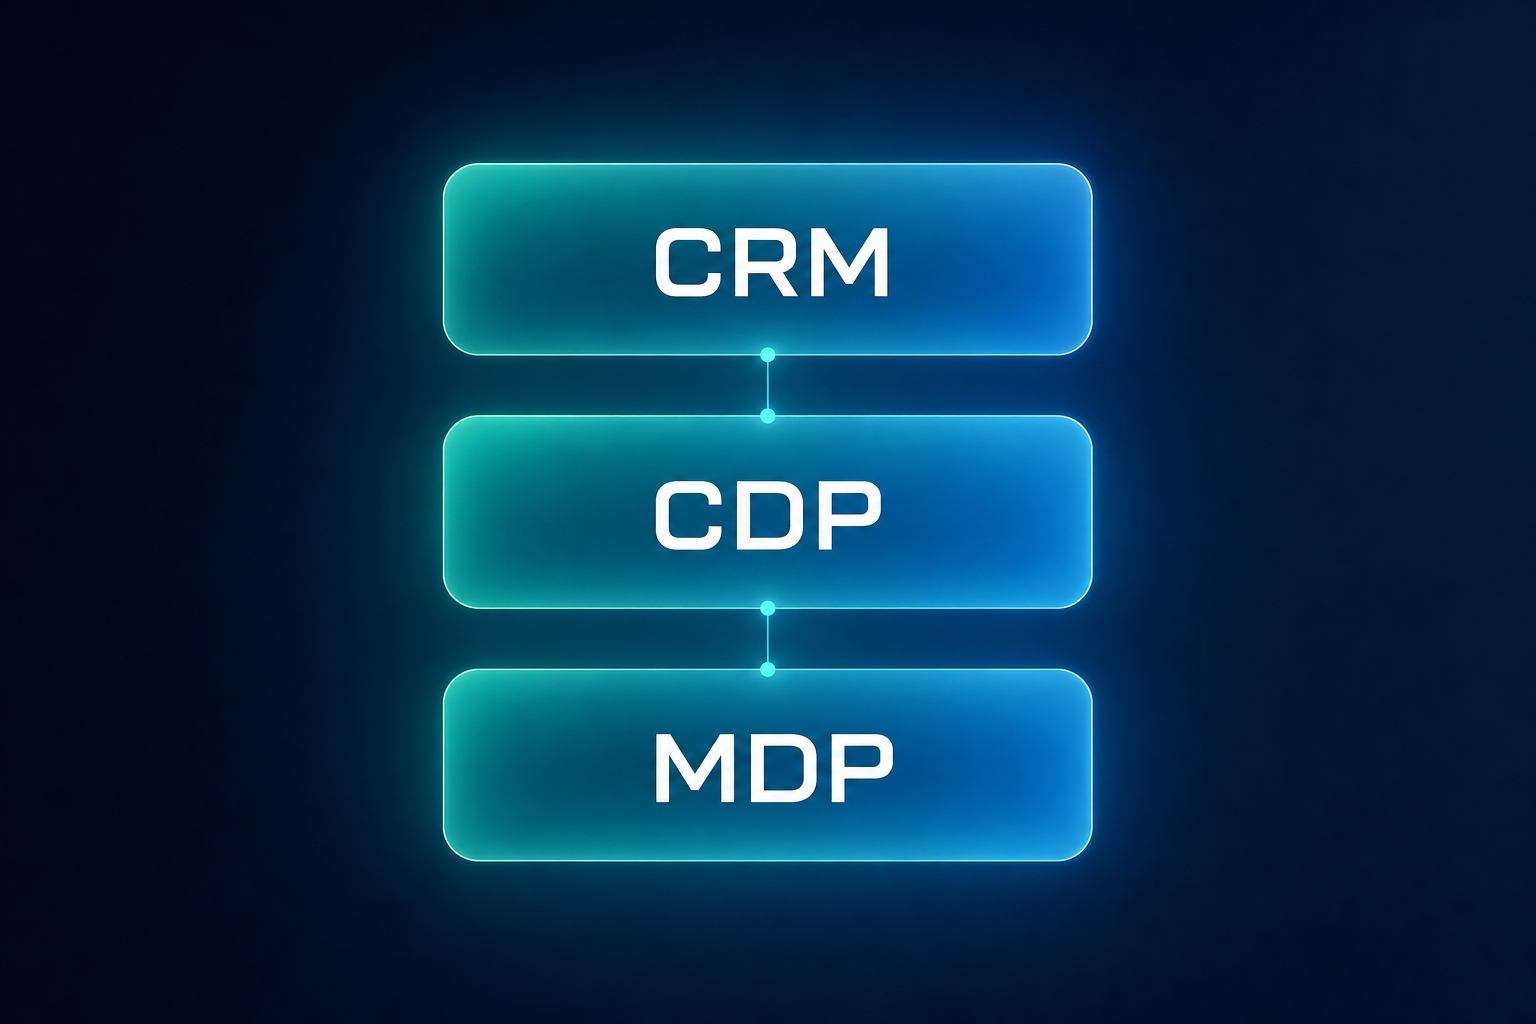
This is the same gap CDP vs. CRM vs. Marketing Data Platform describes: most stacks have channel dashboards and a CRM, but no governed layer that ties spend to CRM revenue with one shared definition.
AI agents are dashboards with autopilot
The 2026 vendor narrative shifted from "better dashboards" to "AI agents that explain why and act." The prerequisite did not change. Agents running on fragmented data produce confident noise faster, not better decisions.
Snowflake's CMO, running marketing for roughly 700 people, described starting the day by querying data directly rather than opening dashboards. She also warned that duplicate agents are already being built across the company and that the same cleanup IT imposed after the SaaS app explosion 15 years ago is coming again.
Christopher Penn's data literacy framing applies directly: AI has no way to know whether input data is correct. It will produce a polished analysis on wrong data. Unpredictably wrong inputs, such as modeled GA4 gaps under consent restrictions or broken GCLID (Google Click Identifier) capture, cannot be compensated for after the fact.
Proactive AI in marketing analytics should surface anomalies before anyone asks. That requires decision-grade, governed inputs first. A Q&A bot on dirty exports is still a dashboard, just with natural language on top.
Decision-grade data, in practice, means metrics consistent enough to present to the board or automate against without a 20-minute definition debate. An agent RFP before a KPI spec exists inverts the sequence. Governance precedes intelligence.
Agents also need a connected warehouse or governed marketing data model: ads, web, and CRM at minimum. Without that layer, the agent analyzes platform silos separately and inherits the same reconciliation problems as the dashboards it was meant to replace.
The claim that AI will replace the analyst overstates the case. It replaces report-pulling. It does not replace the work of defining what to measure, who owns each metric, and which decisions the numbers must support.
The Dashboard Specification: the missing artifact
Bryce Hamrick's Dashboard Specification model defines a shared document that records what is measured, how it is calculated, which system supplies source data, and who owns the result.
The rule for trustworthy reporting is straightforward: define the metric before building the dashboard or deploying the agent.
A KPI spec typically includes these fields:
| Field | Purpose |
|---|---|
| Metric name | Business language, not platform jargon |
| Formula | Explicit choice (e.g. platform ROAS vs blended MER), signed by Finance |
| Source system | Single authoritative source per metric |
| Refresh SLA | Expected update frequency |
| Named owner | One person, not "Marketing team" |
| Backup owner | Coverage when the primary owner is unavailable |
| QA cadence | Weekly source check against the primary system |
| Internal vs external definition | What the board sees vs what ops uses diagnostically |
Shared accountability tends to produce no accountability. When an API breaks and a metric flatlines, someone specific must flag it. RevOps can steward the spec without owning every metric on it.
The practical starting point is a 60-minute executive alignment session: CMO, CFO or Finance representative, and RevOps or data lead. The output is agreement on five to seven metrics before any BI build begins.
A governed marketing data model makes one formula reproducible across every surface. The spec is the contract. A Marketing Data Platform (MDP) is the infrastructure that enforces it.
CKW (AXPO Group) operated with "different numbers, different definitions" across teams before consolidating into one governed view. Data quality reached 95% once definitions and pipelines aligned. The shift was contractual and architectural, not a dashboard redesign.
From dashboard sprawl to three tiers
Vanity metrics should not be deleted. They should be retiered.
A three-tier model separates audience and purpose:
Summary tier (executive): five to seven metrics maximum. Examples include marketing-influenced closed revenue, CAC (Customer Acquisition Cost) or ROMI (Return on Marketing Investment), pipeline velocity, NRR (Net Revenue Retention) or expansion contribution, and time-to-revenue. Pedowitz Group's Revenue Marketing Index 2025 reports that 74% of B2B organizations claim pipeline or revenue as their primary metric, but only 18% have achieved maturity where marketing is accountable for closed revenue. The executive view must reflect that gap honestly.
Operational tier (channel managers): diagnostics such as impressions, CTR (Click-Through Rate), and CPL (Cost Per Lead). These metrics explain drift in summary numbers. When CAC rises 18%, the operational tier shows whether Meta impressions fell while CPC rose.
Forensic tier (analysts): raw platform exports. This tier supports debugging. It does not belong in the board deck without a governed summary above it.
Each executive metric should pass an actionability filter:
- Does it drive a budget or strategy decision?
- Would leadership reallocate resources if the metric doubled or halved?
- Does it tie to CRM revenue, not platform-reported activity alone?
An audit exercise: list every dashboard tab leadership currently sees. Any chart that cannot cite its KPI spec row (formula and owner) should be demoted or removed before evaluating new BI or AI vendors.
Measurement should start with the decision being enabled, not with everything that can be tracked. See how to measure customer journeys from clicks to ROI for a practical playbook that starts from decisions, not tools.
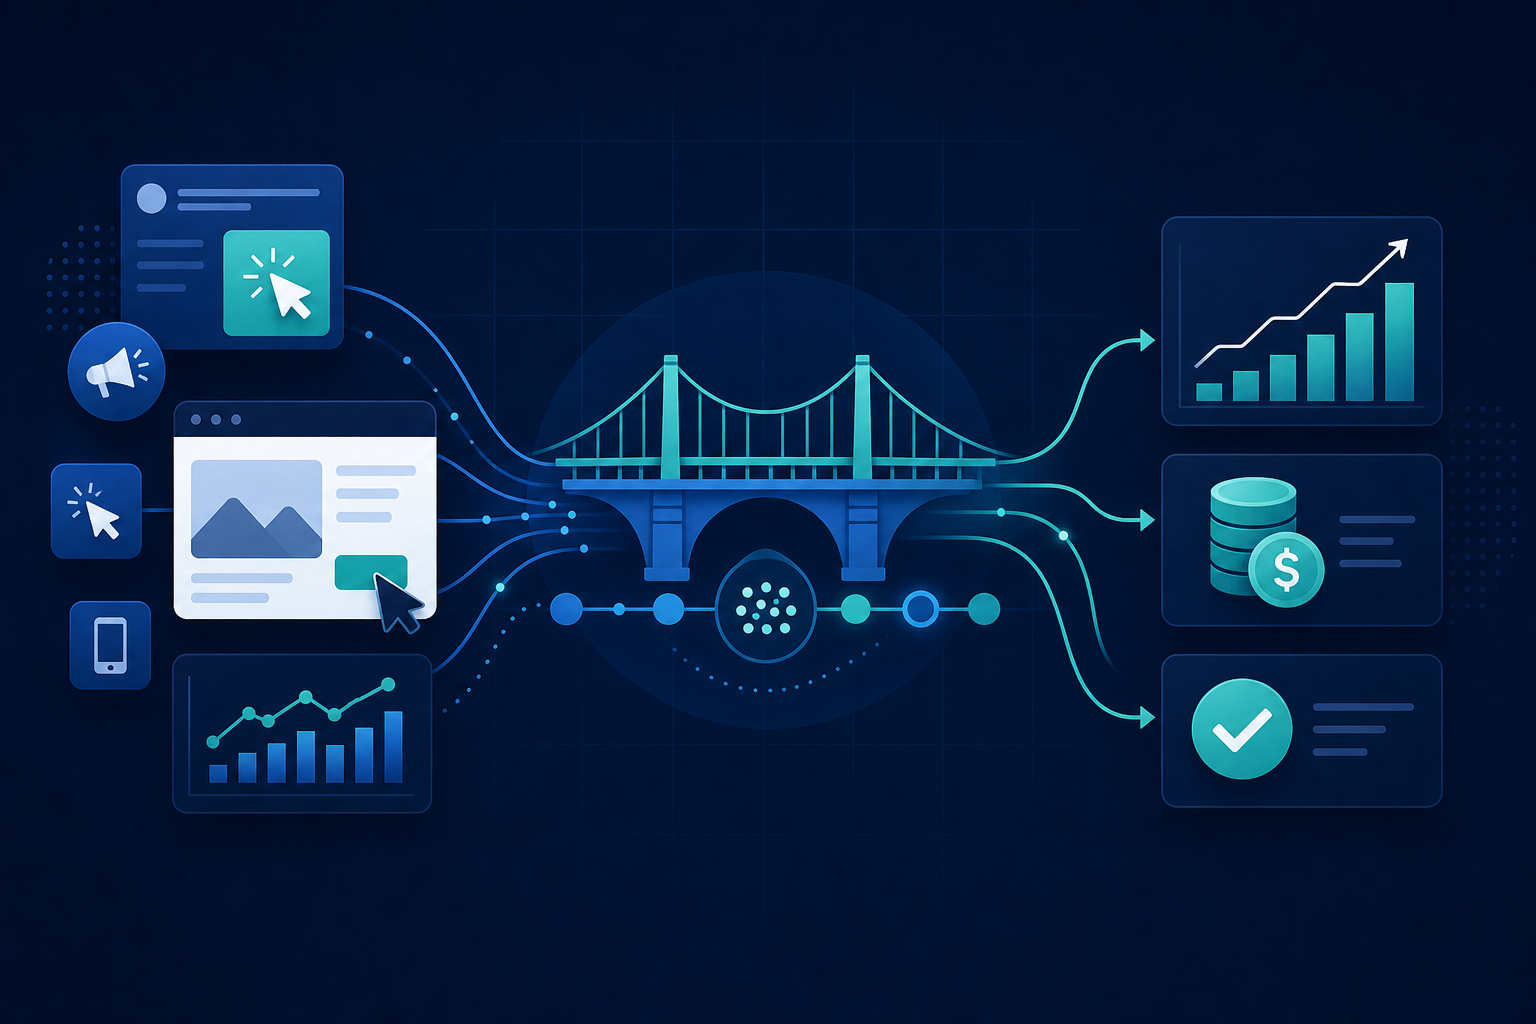
Connected data, not another silo
Data should live connected: web, ads, and CRM at the conversion level. Visualizing platform silos separately recreates the reconciliation problem in a new format.
Connectors move data but often lack governed joins, comparability rules, and CRM revenue events. CKW (AXPO Group) rejected Supermetrics for lacking CRM interconnectivity. The gap was not extraction. It was depth. Compare connector-only setups in Dashflow vs. Supermetrics.
A minimum connected layer before any dashboard or agent includes:
- Governed UTM (Urchin Tracking Module) and campaign taxonomy across ad accounts
- Click identifier capture (GCLID, GBRAID) for paid join paths
- CRM join at revenue or conversion events, not lead creation
- Shared date, currency, and channel dimension definitions
Single source of truth does not mean single view. Different teams need different cuts. A social team needs ad-level performance. A CFO needs channel spend versus revenue. All views should pass through the same governed lens.
When UTM coverage, CRM join rate, or consent completeness falls below threshold, the affected metric should leave the executive dashboard until fixed. Presenting unreliable numbers with confidence costs more than admitting uncertainty.
The University of Zurich Executive Education moved from near-zero to roughly 90% of customer journeys tracked and established one shared view from first click to enrollment. That outcome required connected data, not another reporting tab.
Dashflow operates as a Marketing Data Platform that delivers the governed layer. The Dashboard Specification sits on top as the operating contract. Learn how the pieces fit in our methodology.
Summary
Another dashboard or AI agent will not resolve marketing measurement disputes. A KPI specification with named owners, formulas Finance has signed, and data connected across channels and CRM will.
A practical test: if a chart cannot cite its formula and owner, it does not belong in the board deck.
A 60-day starting sequence:
- Executive alignment on five to seven metrics
- Publication of Dashboard Specification v1 with named owners
- Audit and demotion of orphan dashboard tabs
- Connection of web, ads, and CRM before evaluating BI or AI vendors
Only then do dashboards and agents become delivery mechanisms rather than substitutes for governance.
Free GA4 Review: audits whether web data is decision-grade before adding another reporting layer.
Book a Strategy Call: a 30-minute review to map KPI spec gaps and connected-data prerequisites.
Written by
Dashflow Team